
Korea Foreign Investor Flows: How to Check Net Buying on KRX
The short answer: start with KRX's own data portal
If you want to know whether foreigners are net buying or net selling Korean stocks, the fastest and most direct source is the one the market itself runs: the Korea Exchange’s own data portal, data.krx.co.kr. It is free, needs no account or login, and breaks trading down by investor type — foreign, institutional, individual and a few smaller categories — for the previous business day. It is the same table that daily news lines like “foreigners net sold ₩2.5 trillion” are built from.
This guide walks through where that data actually sits on the KRX site and what it looks like once you open it, how to read the separate monthly figures Korea’s Financial Supervisory Service (FSS) publishes, and where the mechanics for checking a single stock — rather than the whole market — get less certain. As of October 2026, every source named here is free and public; none require a brokerage account to view.
Where it lives, and what the page actually shows
On data.krx.co.kr, the data sits under Statistics → Basic Data → Stock → Trading → Trading by Investor — Korea Exchange’s own label for the page. A related entry in the same menu group, “Trading by investor (individual issue),” applies the same idea to a single stock instead of the whole market; more on that below, including what we could not confirm about it.
The home-page version of this panel shows three market tabs — KOSPI, KOSDAQ and KONEX — each defaulting to the previous business day. The table itself has three columns: Sell, Buy and Net Buying, with every figure in units of KRW 1 billion. A separate panel on the same page applies the identical breakdown to KOSPI 200 futures and options. None of it requires creating an account or paying for a data feed — it is the same raw table that feeds the “foreigners net sold ₩X trillion” line in daily market wrap-ups.
The bigger picture: FSS's monthly scoreboard
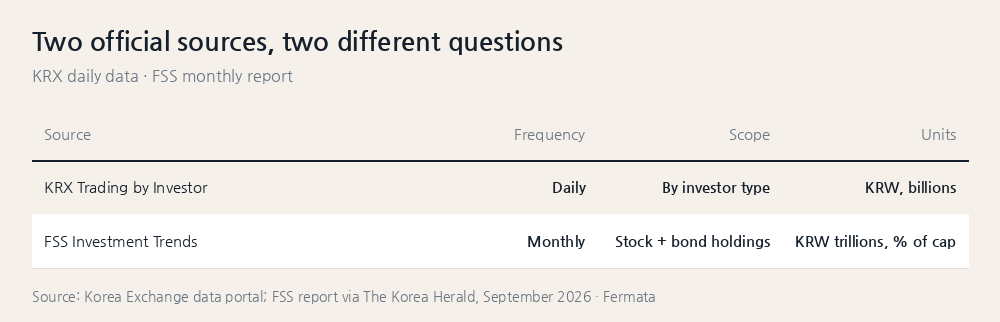
KRX’s page answers “what happened on the last trading day.” For the broader monthly trend — and for how much of the Korean market foreigners own in total — the source is a different regulator: the Financial Supervisory Service (FSS), which releases a monthly report titled “Foreign Securities Investment Trends” covering both stocks and bonds.
The August 2026 edition, released Friday, September 18, 2026, is a useful example of what the report contains. It showed foreign investors making a net purchase of about ₩344 billion in domestic listed shares — their first month of net buying in 2026 — while pulling a net ₩4.74 trillion out of the listed bond market (₩3.94 trillion in net selling plus ₩801 billion in bonds that matured). The same report put total foreign holdings of Korean listed shares at ₩2,280.6 trillion at the end of August, equal to 34.8% of the market’s total capitalization.
We reached these figures through The Korea Herald’s report on the release, not the FSS’s own document directly — the regulator’s report title, the Friday release pattern, and the exact numbers above should be read as confirmed through that secondary coverage.
Checking a single stock, not the whole market
Everything above is market-wide. If what you actually want is whether foreigners were buying or selling one company — Samsung Electronics, SK Hynix, whichever stock you hold — the picture is less settled than the market-wide numbers above.
KRX’s own site lists a dedicated page for this, “Trading by investor (individual issue),” in the same menu group as the market-wide table. We could not load that page’s table directly to confirm its exact columns, date filters, or whether it defaults to a single day or a range, so we are not going to describe it as though we had opened it.
The free tool many individual investors in Korea use for this instead is Naver Finance’s per-stock investor page, commonly reached from a stock’s own listing under an investor-flow tab — several Korean-language market newsletters cite it as their source for daily foreign and institutional net buying by ticker. We did not independently confirm that page’s current layout for this guide either. If you rely on either page, check what you are actually looking at — value or volume, one day or several — before drawing a conclusion from it.
Reading the number right: value, not shares, and rarely cumulative
Two things are easy to misread in KRX’s own table. First, the Sell, Buy and Net Buying columns are in won — KRW 1 billion units — not in shares. A ₩500 stock and a ₩500,000 stock can show similar-looking “net buying” figures that represent very different numbers of shares changing hands. Second, the home-page table defaults to a single day. A string of daily net-selling headlines does not, by itself, tell you whether foreigners have been selling for a week or for six months — for that longer trend, the monthly FSS report above, or KRX’s own date-range filters on its statistics page (not the home-page snapshot), are the tools built for the job.
Neither source tells you why foreigners bought or sold on a given day. A single day’s net buying can reflect an index fund’s rebalancing trade as easily as a change in view on the company — the number is a flow statistic, not a verdict.
What we could and could not verify
We confirmed the menu path, the three market tabs (KOSPI, KOSDAQ, KONEX), and the column labels (Sell, Buy, Net Buying, in units of KRW 1 billion) for KRX’s “Trading by Investor” panel by opening data.krx.co.kr directly in October 2026. We confirmed the August 2026 Foreign Securities Investment Trends figures — the ₩344 billion net stock purchase, the ₩4.74 trillion net bond withdrawal, and the ₩2,280.6 trillion / 34.8% total foreign holdings figure — through The Korea Herald’s September 18, 2026 report on the FSS release; we were unable to load the FSS’s own report page directly to cross-check its original wording. We could not open or confirm the layout of KRX’s own “Trading by investor (individual issue)” page, so we do not describe its columns or filters in this guide. We also did not independently verify the current layout of Naver Finance’s per-stock investor page, though outside sources commonly cite it as a free tool for the same kind of data by ticker. This is not investment advice.
The takeaway
For the market-wide question — are foreigners net buying or net selling Korean stocks, and by how much — Korea Exchange’s own “Trading by Investor” data on data.krx.co.kr is the first and most direct stop, and it is free. For the bigger monthly trend, and for how much of the market foreigners own in total, the Financial Supervisory Service’s monthly “Foreign Securities Investment Trends” report is the official scoreboard; the figures above are from its August 2026 edition, as reported in September 2026.
For a single stock, we could not confirm the exact layout of KRX’s own per-issue page or Naver Finance’s investor tab directly for this guide, so treat the specifics there as something to verify yourself before relying on them. Either way, a single day’s net-buying figure is a flow statistic, not a signal about where a stock is headed next — this is not investment advice.
How we checked
Checked 2026-10-11 against the sources below.
Drafted with AI assistance and reviewed by KimHui.