KOSPI ETFs for US Investors: EWY, FLKR and KORU Compared (2026)
The short answer: cheapest broad exposure is FLKR, not EWY
If you have a US brokerage account, there is no single answer to “how do I buy the KOSPI” — there are three different products, and they are not substitutes for each other. EWY (iShares MSCI South Korea ETF) is the oldest and largest, tracking the MSCI Korea 25/50 Index at a 0.59% expense ratio. FLKR (Franklin FTSE South Korea ETF) tracks a similar basket — the FTSE South Korea Capped Index, built by FTSE Russell — for a fraction of the cost, 0.09%. KORU (Direxion Daily MSCI South Korea Bull 3X ETF) is not a broad Korea holding at all: it targets 300% of the daily return of the same MSCI index and is built to be held for days, not years.
All figures below are from each fund’s own factsheet as of June 30, 2026, cross-checked against each issuer’s live fund page in September 2026. If your goal is ordinary, long-term exposure to Korean large-caps, the fund most people are actually looking for is FLKR, not the more famous EWY.
What these tickers actually are, and the index each one tracks
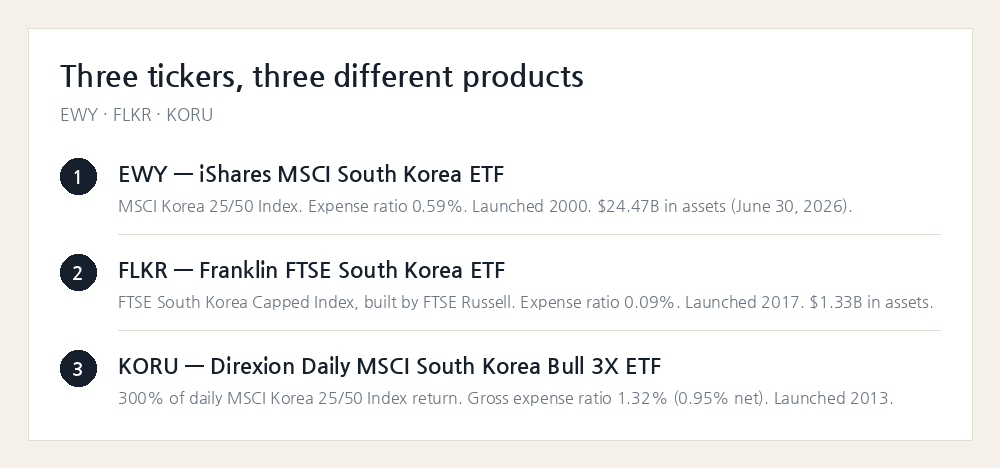
EWY launched in May 2000 and tracks the MSCI Korea 25/50 Index (Net), a benchmark built by MSCI that caps any single stock at 25% and any group of large stocks at 50% of the index — a rule that keeps the fund from being even more concentrated than it already is, given how much of Korea’s market cap sits in a handful of conglomerates. As of June 30, 2026 it held 78 names.
FLKR launched in November 2017 and tracks the FTSE South Korea Capped Index (formally the FTSE South Korea RIC Capped Index), maintained by FTSE Russell, a market-cap-weighted index of Korean large- and mid-cap stocks with a similar concentration cap. It holds more names than EWY — 162 as of June 30, 2026 — because it reaches further down into mid-caps.
KORU tracks the same MSCI Korea 25/50 Index as EWY, but only for a single trading day at a time, at three times the index’s return, before fees. Direxion built it for traders taking a short-term view on Korean equities, not for holding through a market cycle.
The expense-ratio gap is bigger than it looks over time
The expense ratio gap between FLKR and EWY — 0.09% versus 0.59% — looks small written as a percentage, but it compounds every year you hold the position. On a $10,000 position held for ten years with identical gross returns, that half-point-of-cost difference works out to several hundred dollars in fees alone, and it compounds against a growing balance rather than the original $10,000. Franklin Templeton’s own factsheet puts FLKR’s total expense ratio at 0.09%, unchanged since the fund’s 2017 launch.
KORU is priced differently because it is a different kind of product: a 1.32% gross expense ratio, though Direxion’s fee waiver brings the ratio actually charged down to 0.95% once acquired-fund fees are excluded, under an agreement that runs through September 1, 2027. Either way, a leveraged, daily-reset ETF is never the cheap option — and the expense ratio is a minor part of what it costs you to hold one. The daily reset itself does more damage over time than the fee does, which is the subject of the next section.
Size and liquidity: a $24 billion fund next to a $1.3 billion one
Size affects how easily you can get in and out at a fair price. EWY is the giant of the group: $24.47 billion in net assets as of June 30, 2026, and iShares’ own product page showed net assets still above $28.5 billion in mid-September 2026 — enough daily trading volume that the bid-ask spread is rarely a meaningful cost.
FLKR is far smaller, at $1.33 billion as of the same date. That is still a large, liquid ETF by most standards, but the spread and the market-impact cost of a large order will typically run wider than on EWY.
KORU is smaller again, and because it is leveraged, its net assets swing with the market itself — a fund that resets 300% of a daily return can see its size move sharply in a single volatile week, independent of new money coming in or out.
KORU is not a bigger version of the other two
Leveraged ETFs like KORU only promise 300% of the index’s return for one trading day. Over any longer period, compounding a daily reset against a volatile index produces a different number than simply tripling the index’s cumulative return — and it is usually a worse one.
A simplified example: if the underlying index rises 10% on day one and falls 10% on day two, it ends the two days down 1% (1.10 × 0.90 = 0.99). A 3x fund tracking the same index would be up 30% on day one and down 30% on day two, ending at 1.30 × 0.70 = 0.91 — down 9%, not down 3%. The gap widens with volatility and with time. Direxion’s own fact sheet states this outright: the fund “should not be expected to provide three times the return of the benchmark’s cumulative return for periods greater than a day.”
That is why KORU’s own one-year return and three times the MSCI index’s one-year return, printed side by side on the same fact sheet, are not the same number.
The concentration you inherit from all three funds
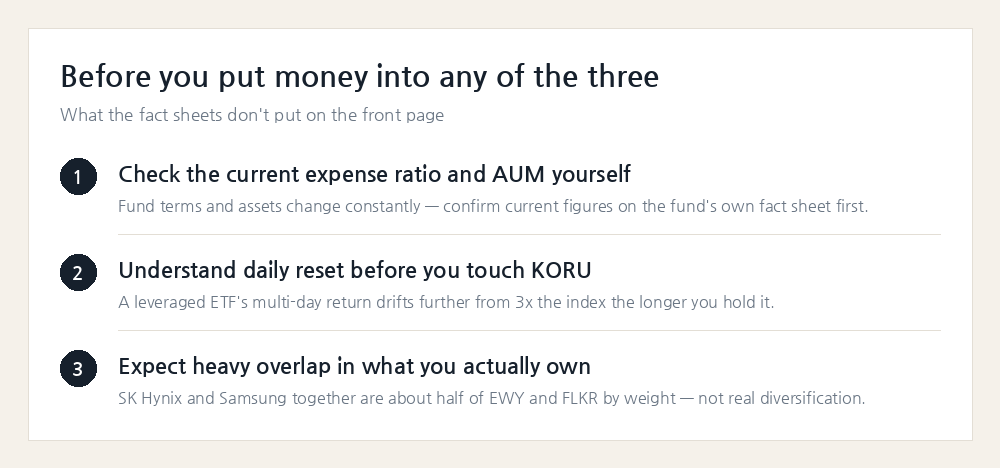
Whichever of the three you hold, you are not really getting diversified exposure to the Korean economy — you are getting concentrated exposure to two chipmakers. SK Hynix and Samsung Electronics together made up about 50% of EWY and roughly 47% of FLKR as of June 30, 2026, and they are the top two holdings of the MSCI index that KORU applies 3x leverage to. If you already hold Samsung Electronics or SK Hynix directly, adding any of these three ETFs mostly adds more of the same two names rather than diversification away from them.
None of the three gives you KOSDAQ exposure — all three track large- and mid-cap KOSPI-listed names. And Korea’s continued classification as an emerging market, not a developed one, by MSCI shapes how much passive index money reaches funds like EWY and KORU in the first place; see our guide to that decision for what would change if that status is ever revisited.
The takeaway
For most US-based investors who want plain exposure to large Korean companies and intend to hold for years, FLKR is the lower-cost way to do it — a 0.09% expense ratio versus EWY’s 0.59% — while tracking a similar index of the same market. EWY’s real advantages are size and a 25-year trading history, not a cheaper index or a meaningfully different set of holdings.
KORU answers a different question entirely. It is a short-term trading instrument built on daily-reset leverage, and holding it through more than a handful of volatile days can produce a return far from “3x the KOSPI” — in either direction.
This guide describes fund terms as of June 30, 2026, cross-checked against each issuer’s own site in September 2026. Expense ratios, holdings and index methodology can all change; confirm the current figures on the fund’s own fact sheet before investing. This is not investment advice.
How we checked
Checked 2026-09-12 against the sources below.